Installation
From OPAM
$ opam install gnuplotFrom Source
    $ make
$ make installNOTE: For a persistent X11 terminal add set term x11 persist to your .gnuplot file in your home directory.
Usage
Documentation
The API-documentation of this distribution can be built with make doc. It can also be found online.
Examples
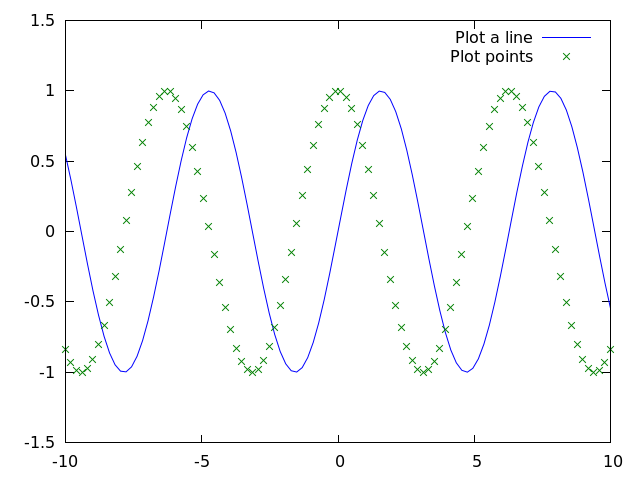
This simple example
    :::ocaml
open Gnuplot

let () =
  let gp = Gp.create () in
  Gp.plot_many gp ~range:(Range.XY (-10., 10., -1.5, 1.5))
   [ Series.lines_func  "sin(x)" ~title:"Plot a line" ~color:`Blue
   ; Series.points_func "cos(x)" ~title:"Plot points" ~color:`Green ];
  Gp.close gp
generates the following plot:
For more examples please refer to the examples-directory of this distribution. You can build the examples with jbuilder, e.g.
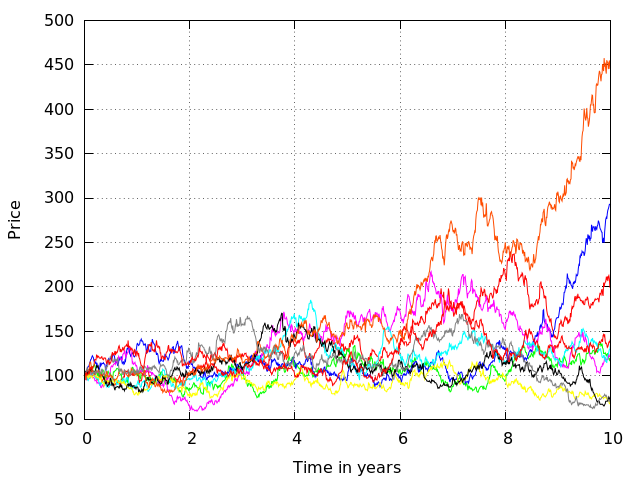
$ jbuilder gbm_paths.exeRunning
$ _build/default/gbm_paths.exedisplays 10 simulated paths of geometric Brownian motion:
Contact Information
In case of bugs, feature requests and similar, please contact:
- Oliver Gu gu.oliver@yahoo.com